I thought I'd share a project I've been working on called WaterLog. It's a home brew reef monitor and data logging system. Ultimately it's meant to be a controller, but I don't yet trust it to control anything. ")
Most of this post is going to be technical details. If you don't care, skip to the bottom!
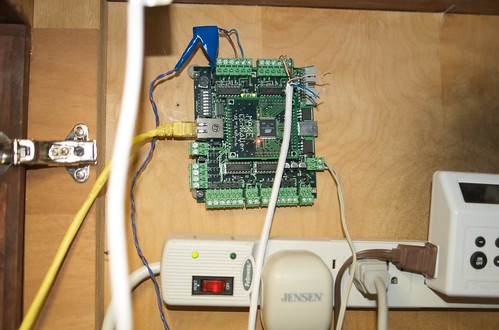
The system is based on the Make Controller Board (www.makingthings.com) which is a little embedded project board that has an Atmel CPU, a bunch of analog and digital IO connectors, an ethernet port, a USB port, a power circuit, and a whopping 64 k of RAM. Compared to a real computer it's from the stone age. Compared to most microcontroller systems, however, it kicks ass.
The board is programmable in C and ships with a nice set of utility libraries. It's got a TCP/IP stack implementation, which means you can program it to talk to the internet with relative ease.
I have the board connected to two pieces of hardware. The first is my Ranco ETC temeprature controller, which can produce a voltage output proportional to temperature. The second is a pH electrode amplifer from MCU Research (http://mcuresearch.com/). Those folks are kind of enough to release specs that allow nerds like me to build stuff with their gear.
I wrote custom firmware for the make controller that just reads the values from the built-in analog-to-digital converters, connects to my web server, and posts the values it read. The script on the web server interprets those values and turns them into pH and temperature readings based on calibration data. It then shoves the pH and temperature readings into a SQL database.
A CGI script, written in python, can then pull data out of the database and produce graphs of it using the google charts API. (http://code.google.com/apis/chart/)
I like this setup because it allows me to store and publish the data on a real web sever, but without needing a whole computer next to the tank.
Now on to the results! I have a page ,waterlog.rgba.net, where I can access the data. The controller logs data once a second and the page refreshes every 5 seconds. I can also embed live graphs into other pages like this:


The data right now is a little wonky because I've been messing with things, calibrating, etc. Those are one day graphs so they should settle out by this time tomorrow.
Well, that's about it! In the future I'll probably add some controller functionality and perhaps some additional data sources. (salinity, maybe ORP, maybe status of pumps and lights and stuff) I'd also like to improve the web page, make it more flexible, make calibration easier, etc. For now, I'm just happy that I got it to a point where I can see graphs of pH and temperature.
Most of this post is going to be technical details. If you don't care, skip to the bottom!
The system is based on the Make Controller Board (www.makingthings.com) which is a little embedded project board that has an Atmel CPU, a bunch of analog and digital IO connectors, an ethernet port, a USB port, a power circuit, and a whopping 64 k of RAM. Compared to a real computer it's from the stone age. Compared to most microcontroller systems, however, it kicks ass.
The board is programmable in C and ships with a nice set of utility libraries. It's got a TCP/IP stack implementation, which means you can program it to talk to the internet with relative ease.
I have the board connected to two pieces of hardware. The first is my Ranco ETC temeprature controller, which can produce a voltage output proportional to temperature. The second is a pH electrode amplifer from MCU Research (http://mcuresearch.com/). Those folks are kind of enough to release specs that allow nerds like me to build stuff with their gear.
I wrote custom firmware for the make controller that just reads the values from the built-in analog-to-digital converters, connects to my web server, and posts the values it read. The script on the web server interprets those values and turns them into pH and temperature readings based on calibration data. It then shoves the pH and temperature readings into a SQL database.
A CGI script, written in python, can then pull data out of the database and produce graphs of it using the google charts API. (http://code.google.com/apis/chart/)
I like this setup because it allows me to store and publish the data on a real web sever, but without needing a whole computer next to the tank.
Now on to the results! I have a page ,waterlog.rgba.net, where I can access the data. The controller logs data once a second and the page refreshes every 5 seconds. I can also embed live graphs into other pages like this:
The data right now is a little wonky because I've been messing with things, calibrating, etc. Those are one day graphs so they should settle out by this time tomorrow.
Well, that's about it! In the future I'll probably add some controller functionality and perhaps some additional data sources. (salinity, maybe ORP, maybe status of pumps and lights and stuff) I'd also like to improve the web page, make it more flexible, make calibration easier, etc. For now, I'm just happy that I got it to a point where I can see graphs of pH and temperature.